Chart Component
Display data visualizations with bar, line, and pie charts
Overview
The Chart component creates data visualizations using three chart types: bar charts, line charts, and pie charts. Each chart type includes customizable axes, tooltips, and optional trend indicators and footers.
Usage
To use the Chart component in your tool handler, follow these steps:
- Import the
ChartUIBuilderandDainResponsefrom the@dainprotocol/utilspackage:
import { ChartUIBuilder, DainResponse } from "@dainprotocol/utils";
- Create a ChartUIBuilder instance and configure it:
const chartUI = new ChartUIBuilder()
  .type("bar")           // Mandatory: 'bar' | 'line' | 'pie'
  .title("Monthly Sales") // Mandatory
  .chartData([           // Mandatory
    { month: "Jan", sales: 4000 },
    { month: "Feb", sales: 3000 }
  ])
  .dataKeys({            // Mandatory
    x: "month",
    y: "sales"
  })
  .description("Sales performance over time") // Optional
  .build();
- Return the ChartUIBuilder instance in a DainResponse object:
return new DainResponse({
  text: "Generated chart visualization",
  data: { /* Your data */ },
  ui: chartUI
});
Configuration
Mandatory Props
- type (
'bar'|'line'|'pie'): The type of chart to display - title (string): The chart's title
- data (T[]): Array of data points for the chart
- dataKeys (object): Mapping of data keys to chart axes
- x (string): Key for X-axis data
- y (string): Key for Y-axis data
- name? (string): Optional key for pie chart segment names
Optional Props
- description (string): Additional context about the chart
- trend (object): Trend indicator information
- value (number): Trend value
- text (string): Trend description
- footer (string): Footer text below the chart
DataKeys Interface
The dataKeys interface defines how data is mapped to the chart:
interface dataKeys {
    x: string;    // Key for X-axis values
    y: string;    // Key for Y-axis values
    name?: string; // Optional: Key for pie chart segment names
}
Examples
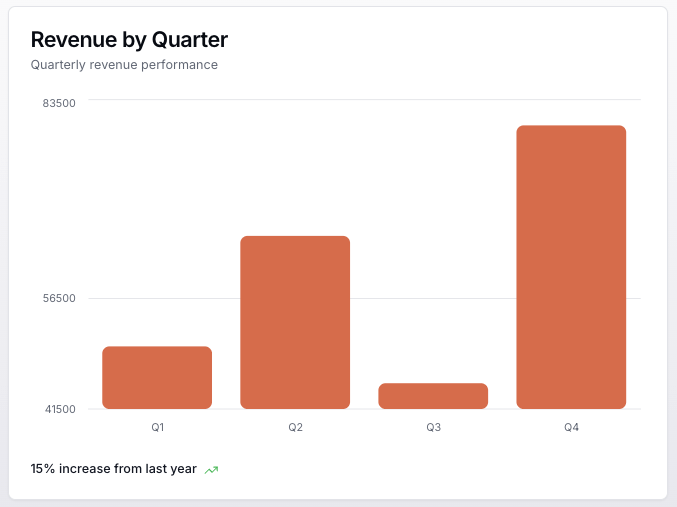
Bar Chart
const barChart = new ChartUIBuilder()
  .type("bar")
  .title("Revenue by Quarter")
  .description("Quarterly revenue performance")
  .chartData([
    { quarter: "Q1", revenue: 50000 },
    { quarter: "Q2", revenue: 65000 },
    { quarter: "Q3", revenue: 45000 }
  ])
  .dataKeys({
    x: "quarter",
    y: "revenue"
  })
  .trend(15, "15% increase from last year")
  .build();

return new DainResponse({
  text: "Revenue Chart",
  data: {},
  ui: barChart
});
Line Chart
const lineChart = new ChartUIBuilder()
  .type("line")
  .title("Daily Temperature")
  .chartData([
    { time: "09:00", temp: 72 },
    { time: "12:00", temp: 76 },
    { time: "15:00", temp: 73 }
  ])
  .dataKeys({
    x: "time",
    y: "temp"
  })
  .footer("Temperature measured in Fahrenheit")
  .build();

return new DainResponse({
  text: "Temperature Chart",
  data: {},
  ui: lineChart
});
Pie Chart
const pieChart = new ChartUIBuilder()
  .type("pie")
  .title("Market Share")
  .description("Product category distribution")
  .chartData([
    { category: "Electronics", value: 45 },
    { category: "Clothing", value: 30 },
    { category: "Food", value: 25 }
  ])
  .dataKeys({
    y: "value",
    name: "category"
  })
  .build();

return new DainResponse({
  text: "Market Share Chart",
  data: {},
  ui: pieChart
});